|
|
Post by honkytonk on Jul 28, 2019 8:16:38 GMT
Hello, work: We have three points aligned. - If the midpoint = total/2 we want a straight curve If we have the midpoint > or < total/2 we want a curved curve (exp log ...  ) The curvature of which will depend on the percentage deviation of the midpoint from the total/2. How to do ? |
|
|
|
Post by tsh73 on Jul 28, 2019 9:51:54 GMT
Draw some examples so folks understand what you want.
(what is "straight curve" anyway?)
so far, there is a single way to put a parabola (ax^2+bx+x) via three points, but midpoint will not be parabola min/max.
|
|
|
|
Post by honkytonk on Jul 28, 2019 11:19:39 GMT
"Curve" in the sense of graphical representation
A straight curve is a curve non curved (a straight).
The question is: Can we draw an exp or log curve with three points?
|
|
|
|
Post by B+ on Jul 28, 2019 13:04:55 GMT
fANSII graphs of log and exp (e) functions of x over a limit x to create fractions ie, ' graph exp(x) and log(x) up to x = 25 2019-07-28 B+ start mods
for x = 1 to 25
print x, string65$(log(x) / log(25))
next
Print "OK, that was log(x) / log(25) on a sideways ANSII graph."
Print
input "Press enter to see exp(x) / exp(25)... "; wate$
for x = 1 to 25
print x, string65$(exp(x) / exp(25))
next
Print "OK, that was exp(x) / exp(25) on a sideways ANSII graph."
function string65$(fraction)
for i = 1 to 65
if i/65 < fraction then b$ = b$ + "X"
next
string65$ = b$
end function
Attachments:
|
|
|
|
Post by honkytonk on Jul 29, 2019 9:25:13 GMT
I conclude that either the midpoint is on the curve (log or exp) or it is not there.
If it is not, how to adjust the curve according to the deviation from where it should be to satisfy log or exp.
|
|
|
|
Post by B+ on Jul 30, 2019 23:14:50 GMT
OK here is a look at exp(x):
' Gridlock Graph Dialog.txt for JB [B+=MGA] 2017-03-07
' from graphing fx.txt finished 2017-03-06
' but want grid to align with axis when possible = gridlock!

' from graphing evalB.txt for JB [B+=MGA] 2017-02-22
' and tsh73 Implicit function, x, y screen functions


global pi, rad, deg, Dflag
global xPs, yPs, xmin, ymin, xmax, ymax  'for xScreen, yScreen functions
xPs = 400 : yPs = 400

pi = acs(-1)
rad = pi / 180
deg = 180 / pi
Dflag = 1       'measure angles in degrees else radians

'xmin=-2*pi : xmax=pi : ymin =-2 : ymax=1  'sin(x)
'xmin=-10 : xmax=5 : ymin =-50 : ymax=10  'quadradic x^2 + 2*x - 35
xmin=-2 : xmax=5 : ymin =-1 : ymax=100  'exp(x)

call ShowGraph
print "Done, bye!"

sub ShowGraph
    WindowWidth = 500
    WindowHeight = 500
    UpperLeftX = int((DisplayWidth - WindowWidth) / 2)
    UpperLeftY = int((DisplayHeight - WindowHeight) / 2)
    open "Graph Dialog" for graphics_nsb_nf as #gd
    #gd "font arial 8"
    #gd "trapclose [quitGraphDialog]"
    #gd "down"

    'graph box section
    #gd "color cyan"
    #gd "backcolor lightgray"
    #gd "place ";0;" ";0
    #gd "boxfilled ";xPs;" ";yPs
    #gd "backcolor white"

    x0 = xScreen(0) : y0 = yScreen(0)

    'xgrid lines
    inc = (xmax - xmin) / 20
    #gd "color cyan"
    if 0 <= x0  and x0 <= xPs then
        start = 0
        while start <= xmax
            scan
            #gd "line ";xScreen(start);" ";0;" ";xScreen(start);" ";400
            start = start + inc
        wend
        start = 0
        while start >= xmin
            scan
            #gd "line ";xScreen(start);" ";0;" ";xScreen(start);" ";400
            start = start - inc
        wend
    else
        start = xmin
        for i = 0 to 20
            #gd "line ";i * 20;" ";0;" ";i * 20;" ";400
            start = start + inc
        next
    end if
    #gd "color black"
    #gd "place ";  2;" ";415;";| x min (left) is ";xmin;"."
    #gd "place ";145;" ";430;";| x scale increment is ";inc;"."
    #gd "place ";170;" ";445;";| x middle is ";xmin + 10 * inc;"."
    #gd "place ";325;" ";460;";| x max (right) is ";xmax;"."

    'y grid lines
    inc = (ymax - ymin) / 20
    if 0 <= y0  and y0 <= yPs then
        start = 0
        while start <= ymax
            scan
            #gd "color cyan"
            #gd "line ";0;" ";yScreen(start);" ";400;" ";yScreen(start)
            #gd "color black"
            #gd "place ";405;" ";yScreen(start);";|";start
            start = start + inc
        wend
        start = 0
        while start >= ymin
            scan
            #gd "color cyan"
            #gd "line ";0;" ";yScreen(start);" ";400;" ";yScreen(start)
            #gd "color black"
            #gd "place ";405;" ";yScreen(start);";|";start
            start = start - inc
        wend
    else
        start = ymin
        for i = 0 to 20
            #gd "color cyan"
            #gd "line ";0;" ";i * 20;" ";400;" ";i * 20
            #gd "color black"
            #gd "place ";405;" ";400 -(i*20);";|";start
            start = start + inc
        next
    end if

    #gd "size 2"

    'x, y axis if in graph
    #gd "color yellow"
    if 0 <= y0  and y0 <= yPs then
        #gd "line ";xScreen(xmin);" ";y0;" ";xScreen(xmax);" ";y0
    end if
    if 0 <= x0  and x0 <= xPs then
        #gd "line ";x0;" ";yScreen(ymin);" ";x0;" ";yScreen(ymax)
    end if

    'fx graph
    #gd "color blue"
    stepper = (xmax - xmin)/xPs
    for xfx = xmin to xmax step stepper
        if xfx <= xmin then
            lastx = xScreen(xfx) : lasty = yScreen(fx(xfx))
        else
            x = xScreen(xfx) : y = yScreen(fx(xfx))
            if x > 0 and x < xPs and y > 0 and y < yPs then
                if lastx > 0 and lastx <= xPs and lasty > 0 and lasty <= yPs then
                    #gd "line ";lastx;" ";lasty;" ";x;" ";y
                end if
            end if
        end if
        lastx = x : lasty = y
    next
    wait

[quitGraphDialog]
    close #gd
end sub

'conversions (logical coords to screen) tsh73 2017-03-04
function xScreen(x)
'global xPs, yPs, xmin, ymin, xmax, ymax  'for xScreen, yScreen functions
    xScreen = (x - xmin) / (xmax - xmin) * xPs
end function

function yScreen(y)
'global xPs, yPs, xmin, ymin, xmax, ymax  'for xScreen, yScreen functions
    yScreen = (1 - (y - ymin) / (ymax - ymin)) * yPs
end function

function fx(x) 'any general function of x
    'fx = sin(x)      'xmin=-2*pi : xmax=2*pi : ymin =-2 : ymax=2
    'fx = x^2 +2*x -35 'roots 5, -7  xmin=-10 : xmax=10 : ymin =-10 : ymax=10
    fx = exp(x)
end function
Pick two end points for midpoint are you talking midpoint on x axis or the function exp(midpoint)?
|
|
|
|
Post by honkytonk on Jul 31, 2019 11:30:31 GMT
Thanks for exp, I'll see what I can do with it, véry thanks
|
|
|
|
Post by tsh73 on Aug 2, 2019 10:52:23 GMT
Hello there I was able to fit exponent over three points using Excel exponent presented in a form a*exp(b*x)+cso we have 3 parameters to fiddle with. Excel minimizes sum of square distances from given points to function values It works if points curve up If points curve down we can change EXP to LOG and it will work. Now, for it to work in JB someone have to white "minimize f(x,y,x) by three variables". Now pictures. Source one 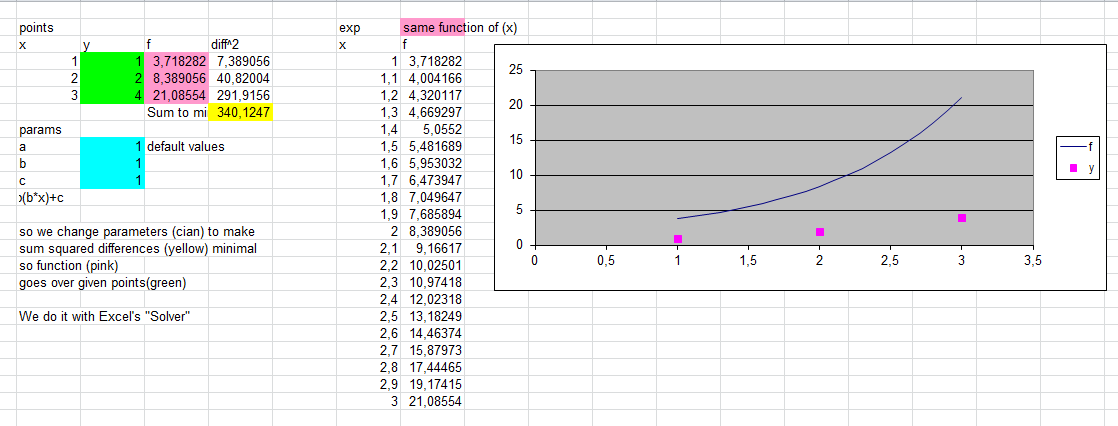 fitted one 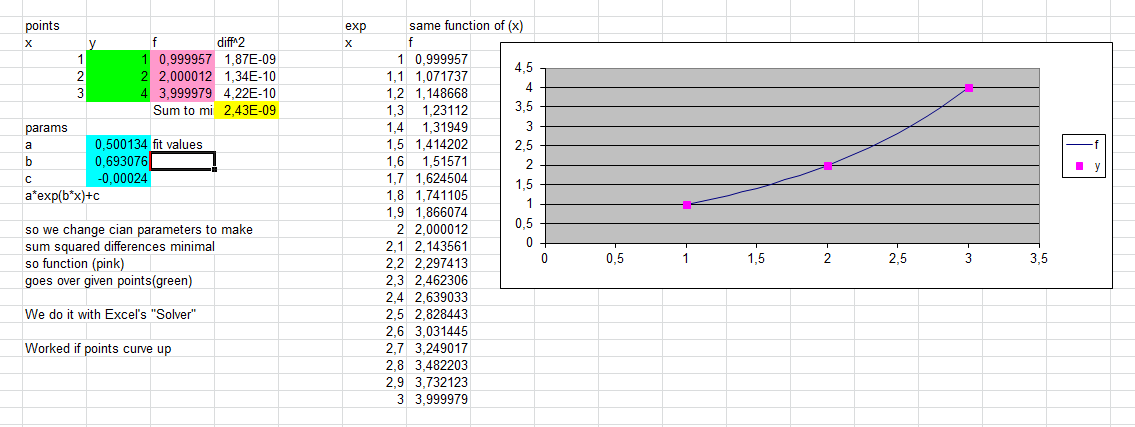 and one with LOG (curved down) 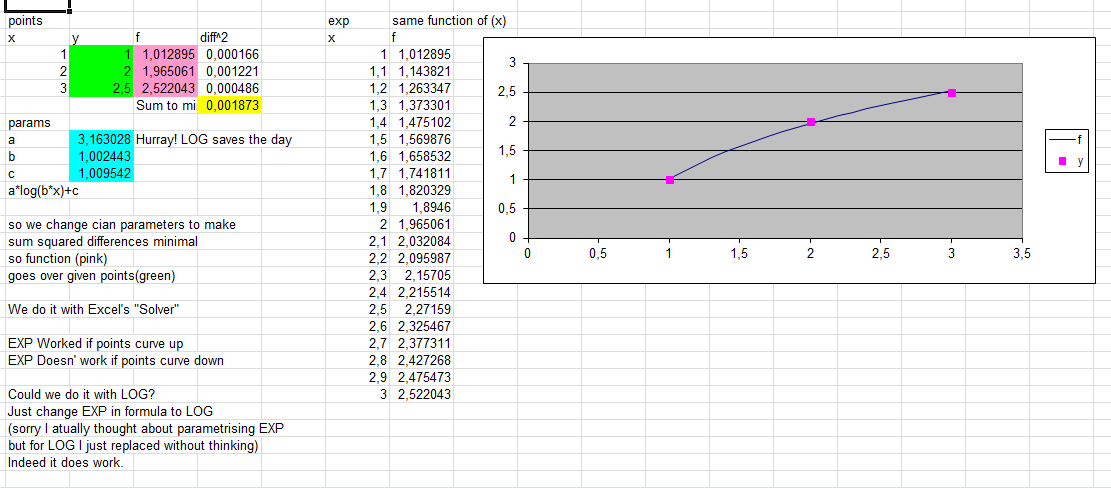 EDIT Oh, I forgot. I's excel "Solver" add-on. You set it to Minimize of yellow cell (with sum of squared differences) changing parameter values (cyan ones). Just press "Solve", and it will get parameters (or says it cannot). 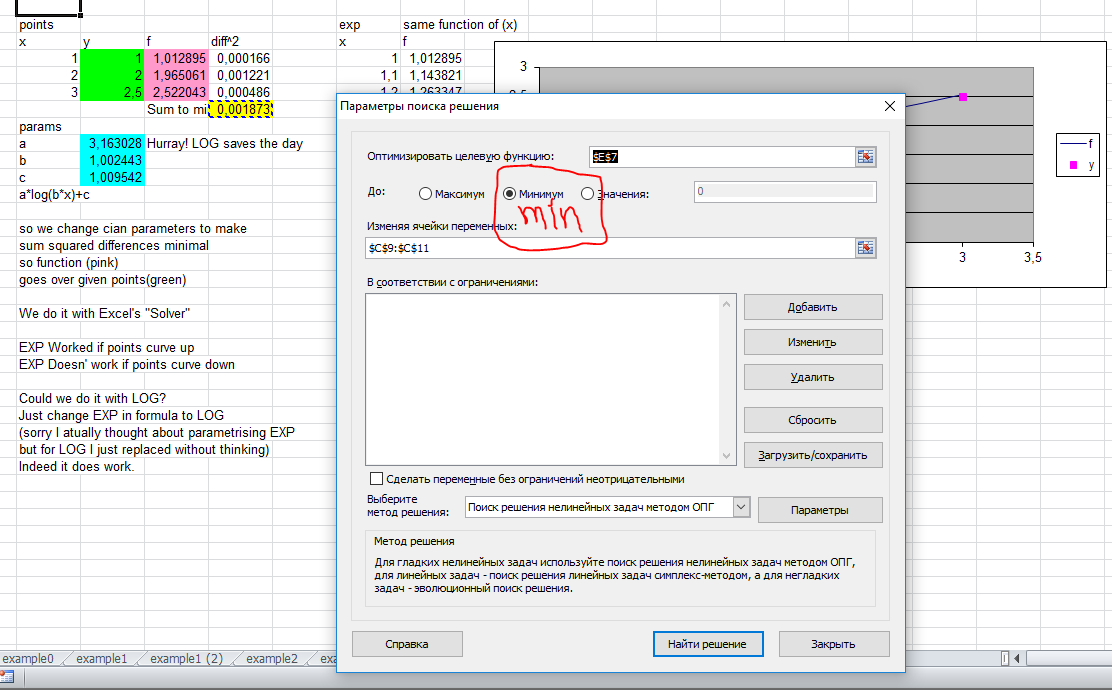 |
|
|
|
Post by tsh73 on Aug 2, 2019 22:49:21 GMT
I kind of did it. Right word is "Coordinate descent" - I did something along it, highly inefficiently  - but it does work. (really should use something better) It goes by finding minimum along one coordinate (parameter), then next one, ... (actually I know that supposed minimum is 0 so end condition is "difference < epsilon") For the first example Numbers are different (obviously Excel uses bigger precision - smaller epsilon. Also likely more clever algorithm) but on the graph (I put numbers I got into same Excel) difference of 1e-2 or 1e-10 is not visible at all anyway. Results: i> x y f df
1> 1 1 3.71828183 2.71828183
2> 2 2 8.3890561 6.3890561
3> 3 4 21.0855369 17.0855369
340.124666> 1 1 1
eps = 0.0001
0.99918639e-4> 0.4664 0.71188 0.05548
accuracy reached
i> x y f df
1> 1 1 1.00591867 0.59186692e-2
2> 2 2 1.99230175 -0.76982508e-2
3> 3 4 4.00237169 0.23716933e-2
fitted function
0.4664*exp(0.71188*x)+0.05548
code: 'Coordinate descent for exponent fitting
'tsh73 Aug 2019
global N
N=3
'x, y pairs to fit
data 1,1, 2,2, 3,4
for i=1 to N
read x, y
x(i)=x: y(i)=y
next
for i = 1 to N
q(i)=1 'initial coeffts
next
call showDiff
call showCoeffts
eps = 0.0001
print "eps = ";eps
h0=.1
d0=d()
k=0 'not valid, will be fixed next line
while 1
k = (k) mod N +1 'next coordinate to optimize along
h=h0
'q(1)=0.1
while 1
scan
'try to fiddle with q(k)
'is + move any good?
q(k)=q(k)+h
d1=d()
if d1<d0 then 'good move
d0=d1
goto [nxt]
else '+ is bad move, is - any good?
q(k)=q(k)-2*h
d2=d()
if d2<d0 then 'good move
d0=d2
goto [nxt]
else 'no good moves, reset to initial and decrease h
q(k)=q(k)+h
if h < eps then exit while 'no better for q(k)
'else
h=h/10
end if
end if
[nxt]
'call showCoeffts
'a$=input$(1)
wend
locate 1,7 'overprint. Comment to see long list
call showCoeffts
'a$=input$(1) 'uncomment for pause
dd=d()
'if abs(dd-lastD)<eps^2 then print "stops converging": exit while
if dd<eps then print "accuracy reached": exit while
lastD=dd
wend
call showDiff
print "fitted function"
print q(1);"*exp(";q(2);"*x)+";q(3)
end
sub showDiff
print "i";"> "; "x";" "; "y";" "; "f",, "df"
for i=1 to N
print i;"> "; x(i);" "; y(i);" "; f(x(i)), f(x(i))-y(i)
next
end sub
sub showCoeffts 'so can step over in debug
print d();"> ";
for i=1 to N
print q(i);" ";
next
print
end sub
function d() 'sum of differences squared
for i=1 to N
d=d+(f(x(i))-y(i))^2
next
end function
function f(x) 'paramerised function to fit data ponts
f=q(1)*exp(q(2)*x)+q(3)
end functionNot much success with LOG variant. It tends to loop - condition "stops converging" is against that. Again, numbers are different; difference is bigger then with EXP, but looks OK on a graph |
|
|
|
Post by honkytonk on Aug 3, 2019 10:02:36 GMT
I tried the fitted function
     NOMAINWIN
    WindowWidth = 600: WindowHeight = 400
    UpperLeftX = 200: UpperLeftY = 20
    BUTTON #w.go, "Go !", [go], UL, 20, 20, 40, 20
    GRAPHICBOX #w.m 5, 5, 585, 360
    OPEN "test" FOR window_nf AS #w
    #w, "TRAPCLOSE [closetest]"
    #w.m  "down;fill darkblue;color white;backcolor darkblue"
    #w.m, "size 2"
    wait
 [go]
    for x=1 to 500
      y=0.4664*exp(0.71188*x)+0.05548 'fitted function
     ' #w.m, "place ";x;" ";y: #w.m, "\ ."
      #w.m, "set ";x;" ";y
    next x
 wait
  [closetest]
    CLOSE  #w
    END
|
|
|
|
Post by tsh73 on Aug 3, 2019 11:06:45 GMT
points to fit are data 1,1, 2,2, 3,4 so you need X in 1..3 (or 0..4) Much scaling needed. You have x going up to 500 exp(500) is VERY big - drawing such Y clips several times (since "comb" on your graph) Here's I used plot program from alycesrestaurant.com/lbpe/Graphics101plotting.htmland added points  nomainwin
global winW, winH, xmin, xmax, ymin, ymax
open "test" for graphics_nsb_nf as #gr
#gr "trapclose [quit]"
#gr "down"
#gr "home"
#gr "posxy w h"
winW=2*w: winH=2*h
'f(x)=1.5*x^2-2*sin(5*x), x in [-2,3]
xmin=0: xmax=4
nPoints=winW 'we have only this much screen dots in X range
dx=(xmax-xmin)/nPoints 'so this will be step in math coordinates
'now, to get ymin, ymax we have to loop
ymin=f(xmin)
ymax=ymin
for x=xmin to xmax step dx
y=f(x)
if ymin > y then ymin = y
if ymax < y then ymax = y
next
'now we just - plot function. Note same loop
#gr "color red"
#gr "size 3"
y=f(xmin)
#gr "set ";sx(xmin);" ";sy(y) 'just set first dot
for x=xmin to xmax step dx
y=f(x)
#gr "goto ";sx(x);" ";sy(y) 'then connect dots
next
'and finally, add axis
#gr "color black"
#gr "size 1"
#gr "line ";sx(xmin);" ";sy(0);" ";sx(xmax);" ";sy(0)
#gr "line ";sx(0);" ";sy(ymin);" ";sx(0);" ";sy(ymax)
'labeling
#gr "place ";sx(0)+5;" ";sy(0)-5
#gr "\0,0"
#gr "place ";sx(xmax)-20;" ";sy(0)-5
#gr "\X"
#gr "place ";sx(0)+5;" ";sy(ymax)+20
#gr "\Y"
'add points
#gr "color blue"
data 1,1, 2,2, 3,4
for i = 1 to 3
read x, y
#gr "place ";sx(x);" ";sy(y)
#gr "circle 5 "
next
#gr "flush"
#gr, "getbmp drawing 1 1 ";winW;" ";winH
bmpsave "drawing", "graph.bmp"
wait
[quit]
close #gr
end
'"any" function. You can change it as you like
function f(x)
f=0.4664*exp(0.71188*x)+0.05548 'fitted function
end function
'To translate X from interval [a,b] to [c,d] we'll do (X-a)/(b-a)*(d-c)+c.
'create two functions: sx(x) and sy(y)
function sx(x)
sx=(x-xmin)/(xmax-xmin)*winW
end function
function sy(y)
sy=winH-(y-ymin)/(ymax-ymin)*winH 'Y is inverted, so winH-...
end function
|
|
|
|
Post by honkytonk on Aug 4, 2019 9:04:52 GMT
Thank you tsh73.
I have work for a year; thank you so much.
|
|

 )
)


 - but it does work.